Bears and Butterflies: Two ways to trade a falling market
There are a thousand ways to skin a cat and there are a similar number of ways to use options to gain a directional exposure to equity markets. The intention of this article is to compare 2 strategies to play a falling market, discussing the pros and cons of each, as well as the common pitfalls and important considerations.
The two strategies we’ll discuss are a Bear Put spread and a long Butterfly Put spread. While the names of these strategies may seem like another language, rest assured we’ll break down the construction and payoff profiles of each, providing an understanding of how to determine which (if any), of the strategies may potentially align with your views.
Each of these strategies may be utilised by investors, either for the purpose of hedging a diversified Australian equities portfolio to offset and minimise losses, or for speculative purposes to potentially profit from a significant fall.
Bear Put
Outlook:
Should you view that the likelihood of the market pulling back is high, though you believe the fall will be limited, a Bear Put spread will potentially allow investors to benefit from a falling market (up to a point), while minimising the cost of implementation by capping their maximum profit.
Construction:
The construction of this strategy is quite simple, requiring the investor to buy a Put and simultaneously sell a Put with a lower strike (both with the same expiry) through their AUSIEX options account.
E.g. XJO 7450 11:15 AM 14/02/2023
Buy 10 x 21st December 2023 Puts, Strike: 6750 @ 203 Points
Sell 10 x 21st December 2023 Puts, Strike: 6250 @ 127.5 Points
Net Debit = 203 - 127.5 = 75.5 Points
Cost of Trade = 75.5 x 10 (contracts) x 10 ($ per point) = $7,550
Note: All examples discussed in this article utilise actual prices at the time stated above and do not accommodate for brokerage or exchange fees for simplicity.
In the above example, the investor benefits from a fall past 6750 to 6250, where any further gain from the bought 6750 Put is completely offset by a loss from the sold 6250 Put.
In the above example, the maximum profit the investor will potentially make, is outlined as follows:
[500 points x 10 ($10 per point) x 10 (contracts)] – $7,550 Premium = $42,450.
Here, the investor has a maximum loss of 75.5 points ($7,550, premium paid) and a potential maximum profit of 424.5 points ($42,450).
Payoff Schedule
| Underlying | Bear Put Profit/Loss | Market Fall (%) | Profit/Loss (%) |
|---|---|---|---|
| 7450 | -75.5 | 0.0% | -100% |
| 7250 | -75.5 | 2.7% | -100% |
| 7000 | -75.5 | 6.0% | -100% |
| 6750 | -75.5 | 9.4% | -100% |
| 6674.5 | 0 | 10.4% | 0% |
| 6500 | 174.5 | 12.8% | 231% |
| 6250 | 424.5 | 16.1% | 562% |
| 6000 | 424.5 | 19.5% | 562% |
| 5750 | 424.5 | 22.8% | 562% |
| 5500 | 424.5 | 26% | 562% |
The above example allows the investors to potentially benefit from a fall in the market beyond the break-even point of 6674.5 or 10.4% ([7450-6674.5]/7450=10.4%), with a potential maximum profit should the market decline beyond 6250 or 16.1% ([7450-6250]/7450=16.1%, yielding the below potential pay-off diagram with 3 distinct outcomes when the positions expire on 21 December 2023.

Figure 1 AUSIEX Derivatives Program
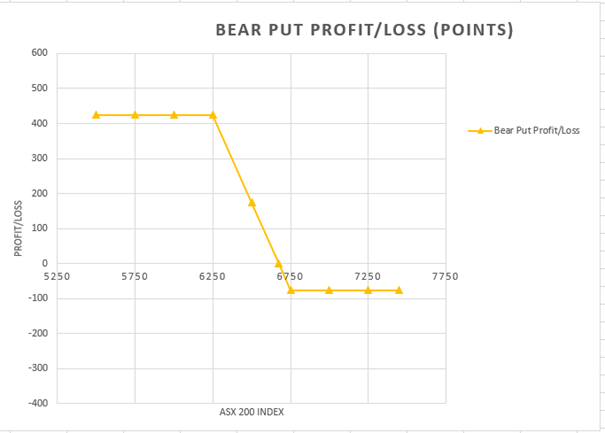
Figure 2 AUSIEX Derivatives Program
XJO > 6750
Should the ASX 200 Opening Price Index Calculation (OPIC) come online above 6750, both the bought 6750 Put and the sold 6250 Put will expire out of the money and hence worthless . The investor in this case could potentially lose the entire amount outlaid of $7,550 or a 100% loss on the trade.
XJO Between 6750 - 6250
Should the ASX 200 OPIC come online below 6750 but above 6250, the bought 6750 Put would expire in the money, offsetting the amount outlaid when initially placing the trade, while 6250 Put will expire worthless out of the money.
For example, should ASX 200 OPIC print at 6650, the 6750 Put would expire 100 points in the money, resulting in a payment of 100 (points) x 10 (contracts) x 10 (points per contract) = $10,000
The 6250 will expire worthless.
The net outcome in this case is: $10,000 – $7,550 = $2450 or a 32.4% profit.
XJO < 6250
Should the ASX 200 OPIC come online below 6250, both the bought 6750 Put and the sold 6250 Put will expire in the money, with the difference in settlement price coming to 500 points.
E.g. Should the ASX 200 OPIC print at 5500 on the morning of expiry;
The bought 6750 Put will expire 1250 points in the money resulting in a payment of 1250 (points) x 10 (contracts) x 10 (points per contract) = $125,000.
The sold 6250 Put will expire 750 points in the money resulting in a debit of 750 (points) x 10 (contracts) x 10 (points per contract) = $75,000.
The potential net outcome in this case is: $125,000 – $75,000 - $7,550 = $ 42,450 or a 562% profit.
Long Butterfly Put Spread
While a Bear Put can be useful where you see a market fall likely, a long Butterfly Put spread can be useful when you hold a higher degree of conviction regarding where the market will bottom and you are looking for a cheaper way to obtain similar benefit.
Construction:
As always, there’s a catch. A long Butterfly Put spread involves simultaneously buying a Put as your first leg, selling twice as many Puts with a strike price further out of the money as your second leg and buying another Put with a strike price again further out of the money as your third leg. Should the market move past where you set your sold Puts, the investor will see their unrealised gain eroded.
E.g.
Buy 10 x XJO 21st December 2023 Puts, Strike: 6750 @203 Points Ratio : 1
Sell 20 x XJO 21st December 2023 Puts, Strike: 6250 @127.5 Points Ratio : 2
Buy 10 x XJO 21st December 2023 Puts, Strike: 5750 @83 Points Ratio : 1
Net Debit = 203 - 2 x 127.5 + 83 = 31 Points
Cost of Trade= 31 x 10 (No. of times the combo is traded) x 10 ($ per point) = $3,100
Note: When trading a Butterfly spread, we consider the lowest common denominator and trade the ratio the maximum number of times.
In this case the lowest ratio for the combination is 1:2:1 which is trade 10 times.
In the above example, the investor again benefits from a fall past 6750 to 6250, however this time as they have sold twice as many 6250 Puts, for any decline past 6250, rather than merely netting out any further gain, the gain is eroded down to 5750, where it is entirely erased.
It is at this point, it becomes clear why the added degree of conviction is so important. Should the investor mis-calculate where the market will bottom, they can see their entire gain erased, ending up at a net loss after accounting for the $3,100 premium to set up the trade.
In the above example the investor has a maximum loss of 31 points ($3,100, premium Paid) and a maximum profit of 469 points ($46,900).
Payoff Schedule
| Underlying | Butterfly Put Profit/Loss | Market Fall (%) | Profit/Loss (%) |
|---|---|---|---|
| 7450 | -31 | 0.0% | -100% |
| 7250 | -31 | 2.7% | -100% |
| 7000 | -31 | 6.0% | -100% |
| 6750 | -31 | 9.4% | -100% |
| 6719 | 0 | 9.8% | 0% |
| 6500 | 219 | 12.8% | 706% |
| 6250 | 469 | 16.1% | 1513% |
| 6000 | 219 | 19.5% | 706% |
| 5781 | 0 | 22.4% | 0% |
| 5750 | -31 | 22.8% | -100% |
| 5500 | -31 | 26.2% | -100% |
| 5250 | -31 | 29.5% | -100% |
The above example allows the investors to potentially benefit from a fall in the market beyond the initial break-even point beyond of 6719 or 9.8% ([7450 - 6719] / 7450 = 9.8%), with maximum profit should the OPIC at expiry decline to 6250 or 16.1% ([7450 - 6250] / 7450 = 16.1%), yielding the below pay-off diagram with 4 distinct outcomes when the positions expire on 21 December 2023.
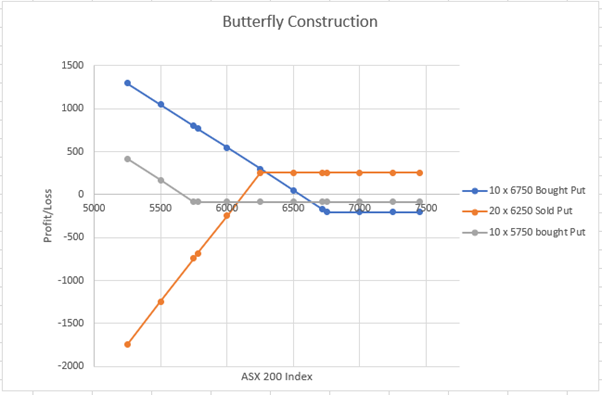
Figure 3 AUSIEX Derivatives Program

Figure 4 AUSIEX Derivatives Program
XJO > 6750
Should the ASX 200 (OPIC) come online above 6750, the bought 6750 Put, the sold 6250 Put and the bought 5750 Put will expire out of the money and hence worthless. The investor in this case would lose the entire amount outlaid of $3,100 or a 100% loss on the trade.
XJO Between 6750 - 6250
If the ASX 200 OPIC came online below 6750 but above 6250, the bought 6750 Put would expire in the money offsetting the amount outlaid when initially placing the trade, while the sold 6250 Put and bought 5750 Put will expire worthless out of the money.
E.g. Should the ASX 200 OPIC print at 6650;
The bought 6750 Put would expire 100 points in the money, resulting in a payment of 100 (points) x 10 (contracts) x 10 (points per contract) = $10,000
The sold 2 x 6250 Puts will expire worthless.
The bought 5750 Put will expire worthless.
The net outcome in this case is: $10,000 – $3,100 = $6,900 or a potential 222.5% profit.
The profit will potentially increase until the XJO reaches 6,250, where the maximum profit is received.
XJO Between 6250 - 5750
If the ASX 200 OPIC comes online below 6250 but above 5750, the bought 6750 Put and sold 6250 Puts would expire in the money, while the bought 5750 Put will expire worthless out of the money.
In this case, the gain from the 6750 Put will be at least partially eroded by the loss of twice as many sold 6250 Puts.
E.g. Should the ASX 200 OPIC print at 6000;
The bought 6750 Put would expire 750 points in the money, resulting in a payment of 750 (points) x 10 (contracts) x 10 (points per contract) = $75,000.
The sold 2 x 6250 Puts would be 250 points in the money, resulting in a debit of 250 (points) x 20 (contracts) x 10 (points per contract) = $50,000.
The bought 5750 Put will expire worthless.
The net outcome in this case is: $75,000 – $50,000 – $3,100 = $21,900 or a 706.5% profit.
The potential profit will decrease until the XJO reaches 5,750 which is maximum loss.
XJO < 5750
Should the ASX 200 OPIC come online below 5750, the bought 6750 Put and the sold 6250 Put and the bought 5750 Put will expire in the money, where the gain from the 2 bought Puts will be completely offset but the loss from the sold 6250 (as twice as many were sold).
E.g. Should the ASX 200 OPIC print at 5500 on the morning of expiry;
The bought 6750 Put will expire 1250 points in the money resulting in a payment of 1250 (points) x 10 (contracts) x 10 (points per contract) = $125,000.
The sold 6250 Put will expire 750 points in the money resulting in a debit of 750 (points) x 20 (contracts) x 10 (points per contract) = $150,000.
The bought 5750 Put will expire 250 points in the money resulting in a payment of 250 (points) x 10 (contracts) x 10 (points per contract) = $25,000.
The net outcome in this case is: $125,000 – $150,000 – $25,000 - $3,100 = -$3,100 or a -100% loss.
Summary
While the examples outlined exclude transaction costs, it is important to consider them when comparing the two strategies. As brokerage is typically charged by brokers per leg and the ASX charge exchange fees per contract, the butterfly will typically carry a higher transaction cost to employ.
While the two strategies discussed balance cost/profit potential against certainty surrounding market direction and downside potential, there may be other trade-offs investors need to consider when weighing up different strategies. The purpose of this article is not to promote one strategy over the other, but rather contrast the differences to assist investors in thinking about their own view and how to utilise the tools at their disposal with an AUSIEX options account to best align their trading with their views accordingly.
About the Author
Lewis Taie, Manager - Derivatives Program
Lewis joined Ausiex in 2016, having previously worked with Colonial First State.
During his time with AUSIEX Lewis has led both their Exchange Traded Options desk and High Value Client offering.
Lewis’ primary focus is currently the growth and delivery of AUSIEX’s enhanced derivatives program, managing relationships and the end-to-end experience of all client segments while efficiently managing clearing, credit and market risk.
Lewis holds a Bachelor of Economics from the University of Sydney and is a accredited Designated Trading Representative.
Contact
Should you have any queries regarding the implementation of Exchange Traded Options within your business, please don’t hesitate to reach out directly. Lewis.Taie@AUSIEX.com.au
IMPORTANT INFORMATION AND DISCLAIMER
This document is published by Australian Investment Exchange Limited (AUSIEX) ABN 71 076 515 930 AFSL 241400, a Market Participant of ASX Limited and Cboe Australia Pty Ltd, a Clearing Participant of ASX Clear Pty Limited and a Settlement Participant of ASX Settlement Pty Limited.
This document provides general market-related commentary only. It is not intended to be an investment research report. This document has been prepared without taking into account your objectives, financial situation or needs. It is not to be construed as a solicitation or an offer to buy or sell any securities or financial instruments, or as a recommendation and/or investment advice. Before acting on the information in this report, you should consider the appropriateness and suitability of the information, having regard to your own objectives, financial situation and needs and, if necessary, seek appropriate professional or financial advice.
AUSIEX believes that the information in this report is correct and any opinions, conclusions or recommendations are reasonably held or made based on information available at the time of its compilation, but no representation or warranty is made as to the accuracy, reliability or completeness of any statements made in this report. AUSIEX is under no obligation to, and does not, update or keep current the information contained in this report. Neither AUSIEX nor any of its affiliates accepts liability for loss or damage arising out of the use of all or any part of this report. All material presented in this document, unless specifically indicated otherwise, is under copyright of AUSIEX.
This document is not directed to, nor intended for distribution to or use by, any person or entity who is a citizen or resident of, or located in any locality, state, country or other jurisdiction where such distribution, publication, availability or use would be contrary to law or regulation or that would subject AUSIEX to any registration or licensing requirement within such jurisdiction.
Related Articles